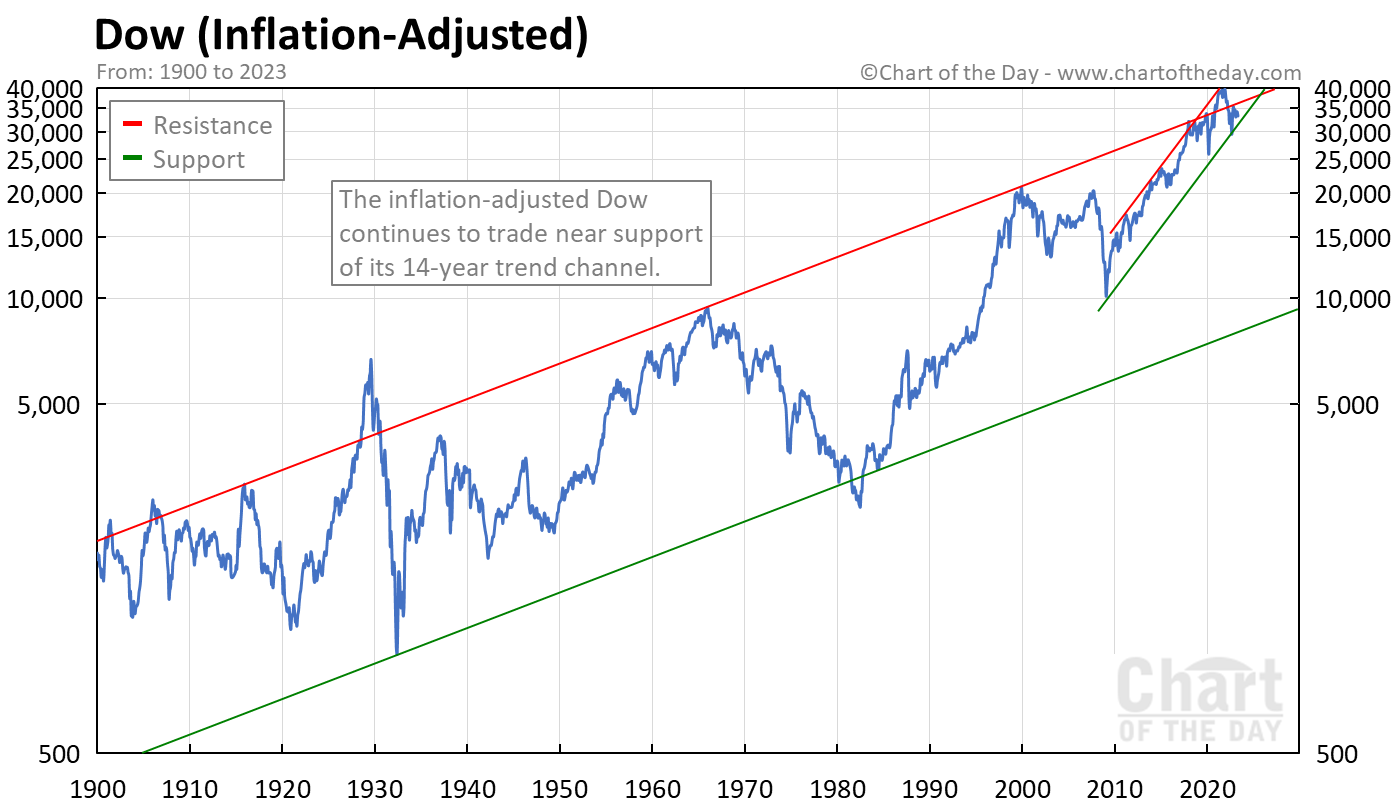
As you can see, 95% of the DJIA increase is PURE INFLATION.
https://www.marketwatch.com/story/the-s-p-500-is-almost-never-this-expensive-its-a-disaster-waiting-to-happen-27364fa9
Nothing says we’re teetering on the brink of World War III quite like a U.S. stock market that’s even more expensive, in relation to its underlying fundamentals, than it was at the peak in 1929.
The issue isn’t just the terrifying situation in the Middle East, either. The U.S. economy is also slowing, the Federal Reserve just slashed interest rates, and we face a pivotal presidential election. Oh, and China, the world’s second-largest economy, is stumbling.
Yet the S&P 500
SPX
0.77%
index, which is the cornerstone of almost every reader’s 401(k), IRA and other retirement accounts, currently sells for a higher multiple of average earnings than at almost any time in history.
The so-called cyclically adjusted or Shiller price-to-earnings ratio, named after Nobel Prize winner and Yale finance professor Robert Shiller, is currently 35. This ratio compares stock prices to the average corporate earnings of the past decade, adjusted for inflation. Shiller was awarded the Nobel Prize for economics for showing how it had been a powerful predictor of future investment returns.
The current ratio is higher than the peak in 1929 (when it hit 33), let alone the late 1960s (when it was just 22). Both proved terrible times for investors. Actually, on this measure, the S&P 500 has only been more expensive on two occasions before this summer: During the Greatest Bubble in History from 1998 to 2001, and during the post-COVID mania of 2021-22.
Both also proved bad times to be an investor.
Check out this chart from Mindful Advisory, a money-management firm in New Jersey. Using Shiller’s own data, it tracks all the monthly cyclically adjusted PE ratios since 1881 from the cheapest (bottom left) to the most expensive (top right).


Message Thread
![]()
« Back to index
