![]()
 on January 29, 2022, 9:05 am

BLUE LINE = BRLUSD
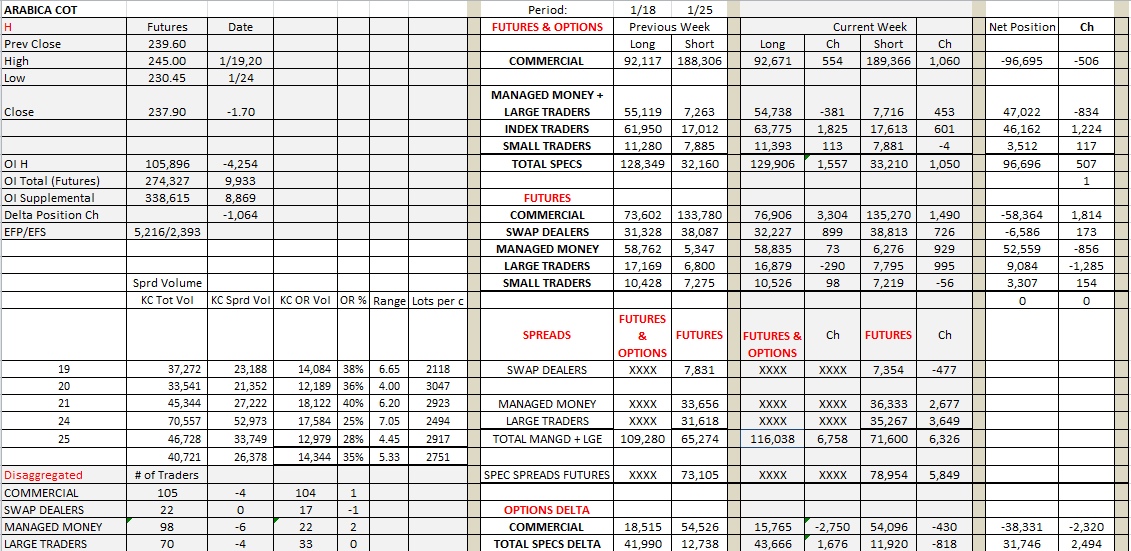
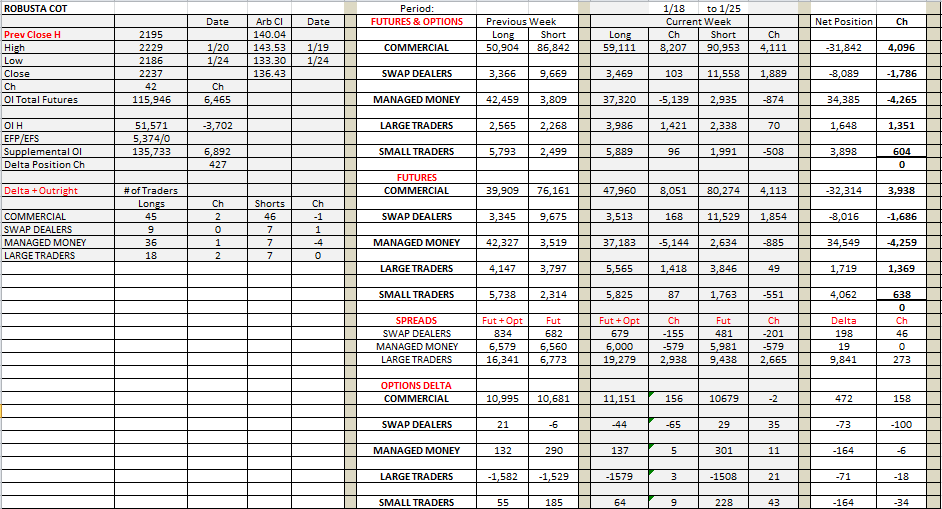
The market changed by -1.70c for the COT report week but with a range 0f 14.55c rendering a fairly flat Arabica report. Although the fund net position changed by only -856 lots, 6 long funds liquidated, and two funds joined the shorts. Part of the small net change is due to the increase of 1,224 lots bought in the Index category. Large traders also sold while commercials bought. In Robusta, funds were large sellers for the third week straight, keeping the arbitrage at an elevated level. Both markets reflect a drop in the H contract as the roll begins. Interestingly, both markets experienced an increase in the total OI which could possibly mean new selling and buying but it is difficult to tell as the spread OI increased as well. The busiest day of the week, the 24th with a volume of 70,557 lots and a range of 7.05c, had an outright volume of only 17,584 lots or 25% of the total.
The remainder of the week proved to be mostly weak as prices eased towards the 230.00 level while the $ gained in value and volatility in equities was unprecedented. Global tensions increased and two reliable production estimates were released that showed a better crop projection than anticipated. There was one interruption in the weakness which took place on Friday. Prices suddenly strengthened as spreads became very volatile. The UZ at one point traded to around 4.00c. A rumor was floating that a natgas trader was forced to liquidate all their positions. The validity of this rumor has not been confirmed. But spreads are steady nonetheless as warehouse stocks continue to drop and shipping logistics continue to be challenged. The WSJ reports that the east coast of the US is now becoming negatively impacted by shipping issues. Up to know problems only existed in the west coast. The HK however has been weak as the H liquidation takes place. KN ended steady but this spread as well shows some frailty.
As to the general market behavior it is on the weak side but it is not exhibiting fragility. I think that Nagual's charts provide an appropriate picture of market projections.
Nagual, would you happen to have a DX chart? TIA


Message Thread
![]()
« Back to index